
TacTip construction
Much of this work is published in this paper and my PhD thesis.The TacTip is a variant of optical tactile sensing. A camera faces a deformable body with markers. Based on the movement of these markers, texture, edges, or object properties can be classified. As a popular sensor in the field, we decided to construct one for further testing.
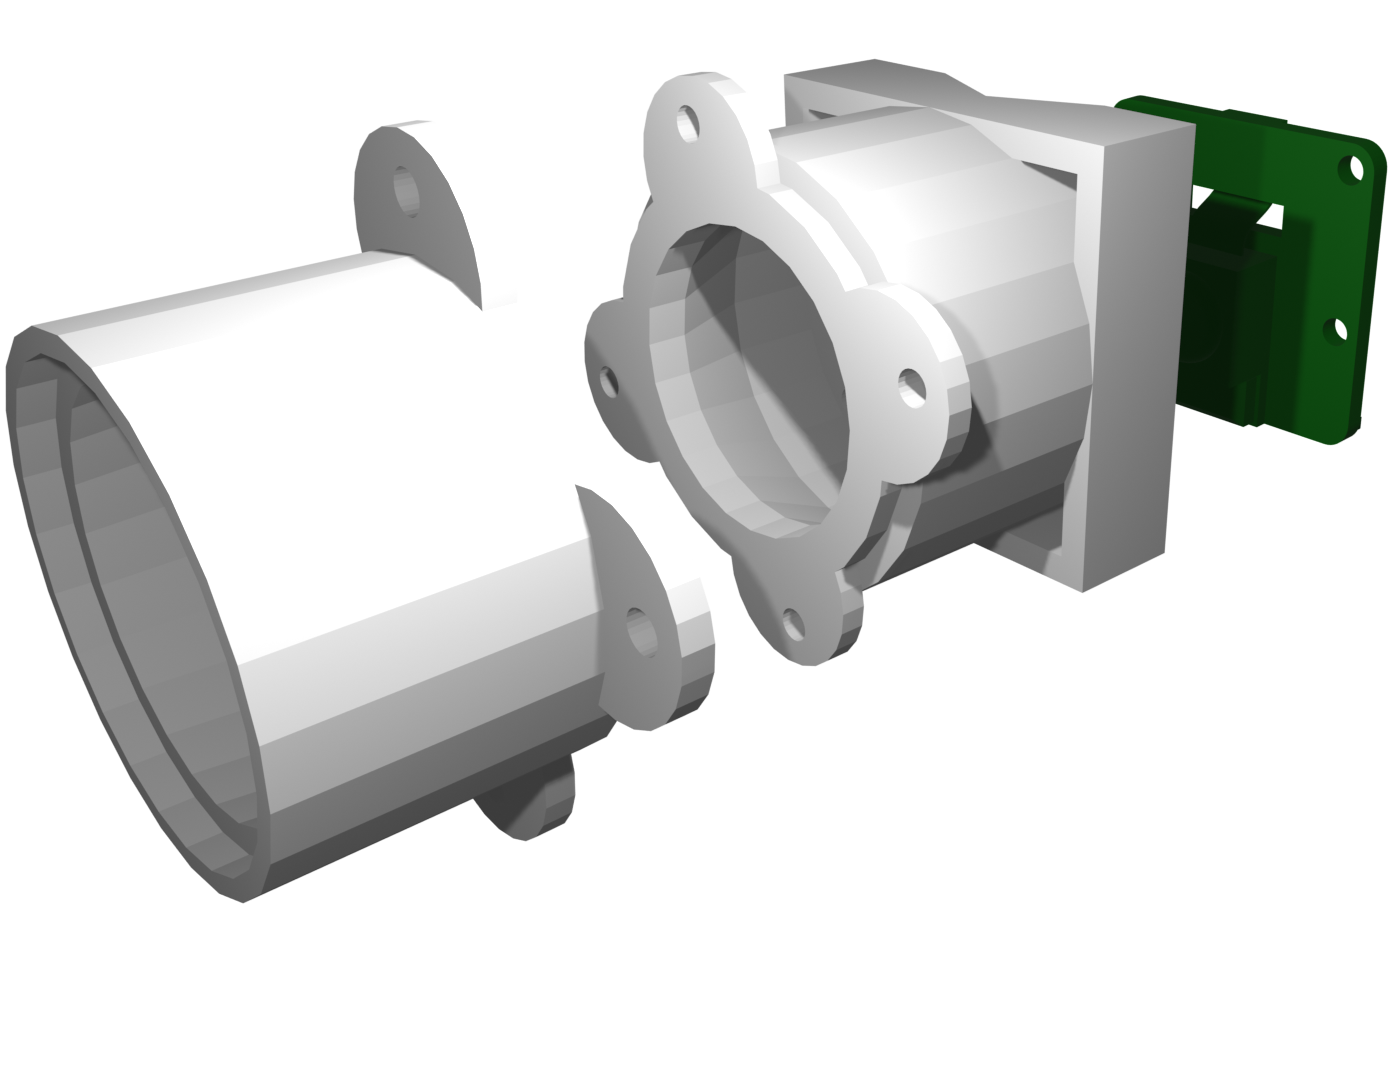
The TacTip parts were 3D printed and consisted of a camera mount, main body, tip, and LED ring. The camera mount was edited in CAD software to mount our webcam (Arducam USB wide-angle lens), and the main body attached to the mount via a series of screws.
Different cameras were trialled, including autofocus, fisheye, wide-angle, and a standard webcam. The standard webcam was a 720p Logitech webcam with a 55° field of view.
The fisheye was an Arducam 2.4-megapixel camera with a fixed focus of 10° (D) × 86° (H) × 47° (V). Finally, we used an autofocus lens with the Arducam camera. We found that the autofocus was not reliable as it could change visuals while refocusing, leading to incoherent data. The Fisheye Arducam gave a high resolution image all the time. On the cheaper end we were unable to get images in focus.
The files were printed using PLA filament on an industrial high-resolution printer (Stratasys Objet 30 Prime). Between the tip and the main body; there is a PCB of small LEDs (3.15V 1608 (0603) SMD) that provide light (45-180mcd each). The camera detects reflection of the LED light from the white painted tips on the surface of the skin. The PCB made use of 6 surface-mount LEDS and 6 120ohm surface-mount (0603) capacitors. The LED PCB was mounted in the rim of the main body, where the LEDs face the skin, to illuminate the pointers for the camera. The wires are pressed into a printed groove that leads to a hole allowing for power connection. The camera was mounted onto a custom 3D printed part that connected to a USB wide-angle lens webcam. The power of the LED ring was connected to the power of the USB camera for wiring efficiency.
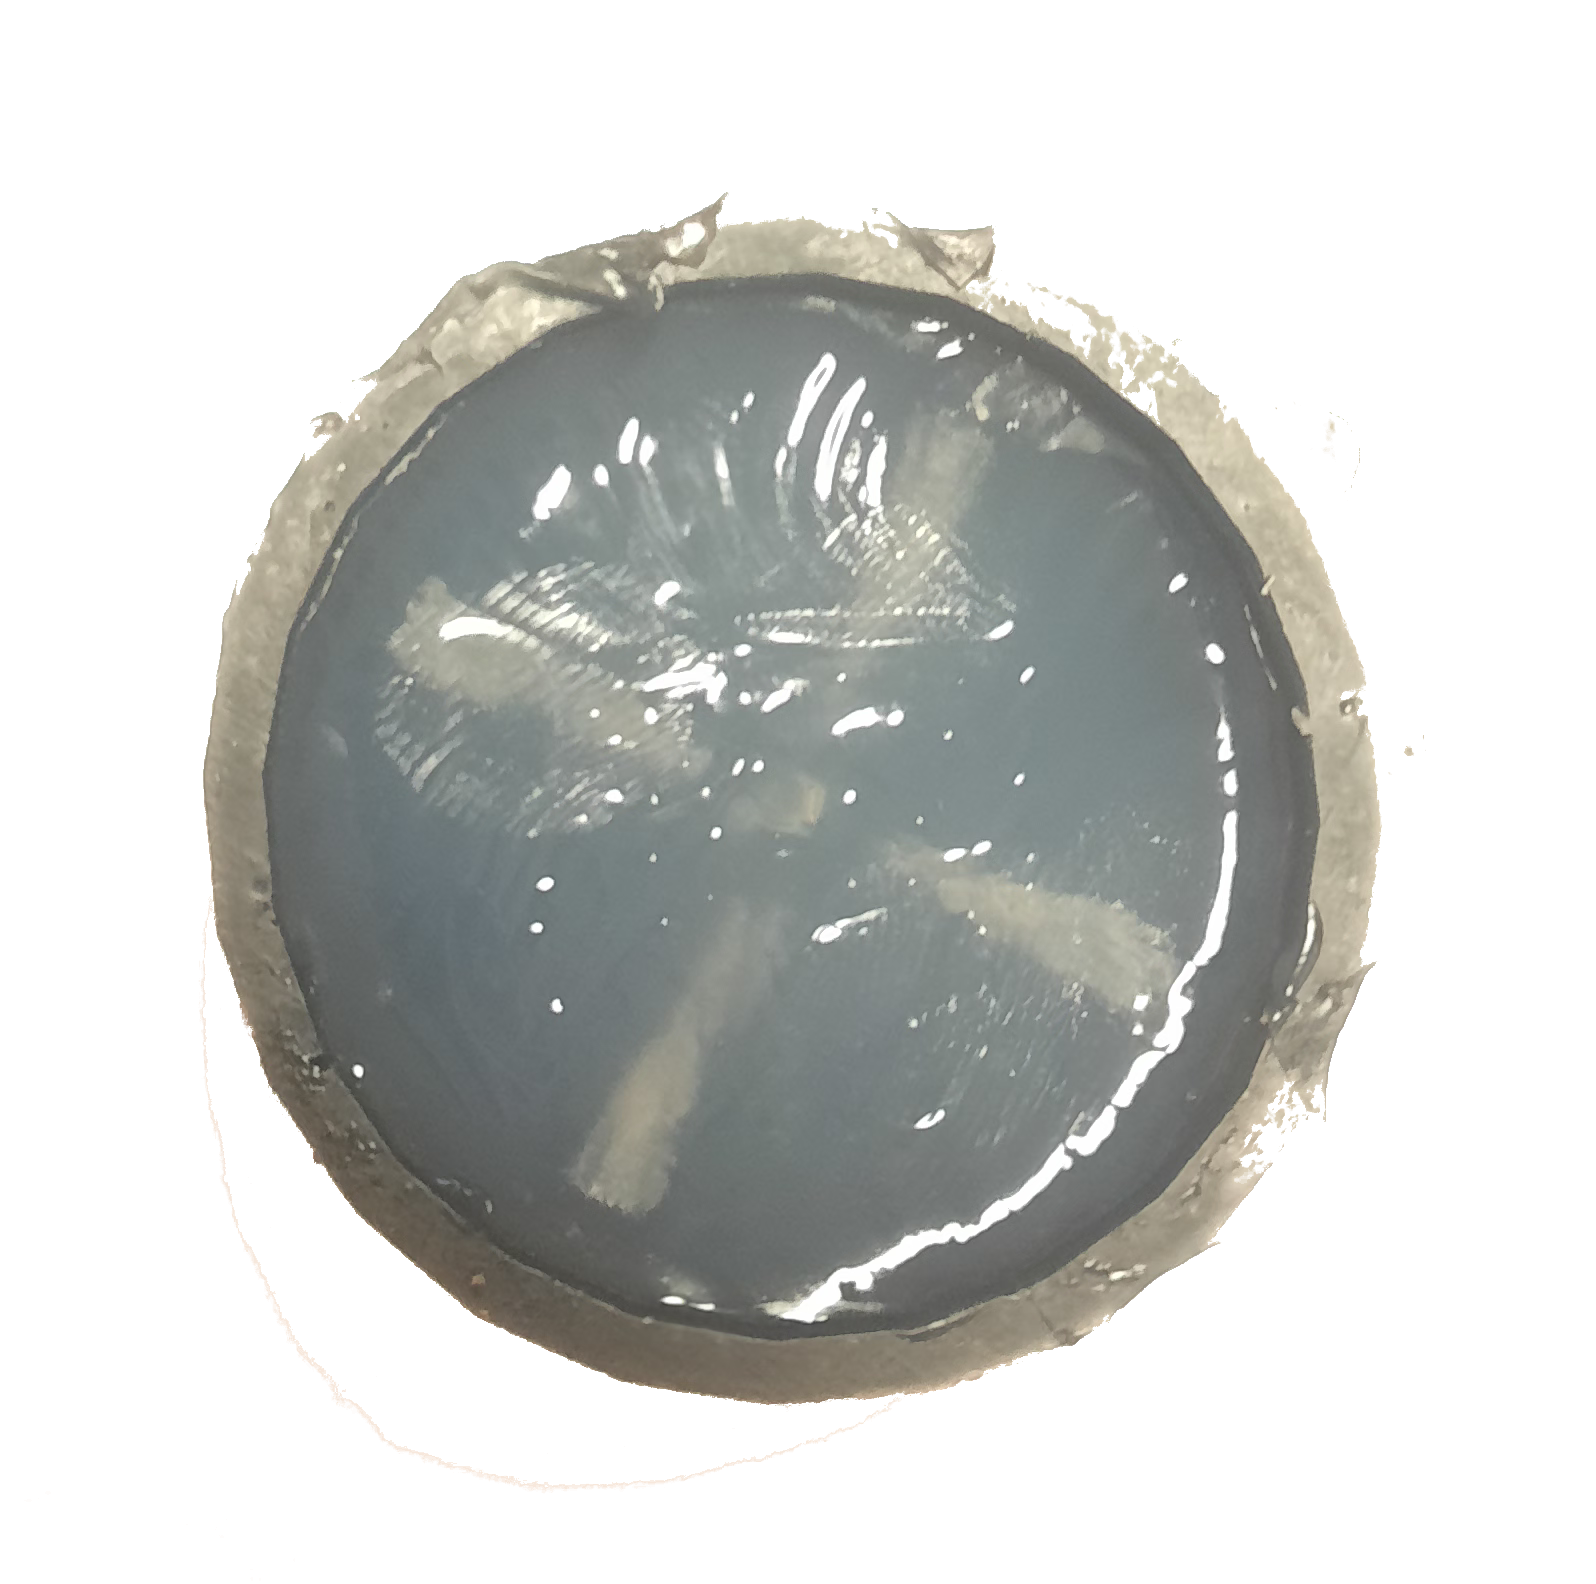
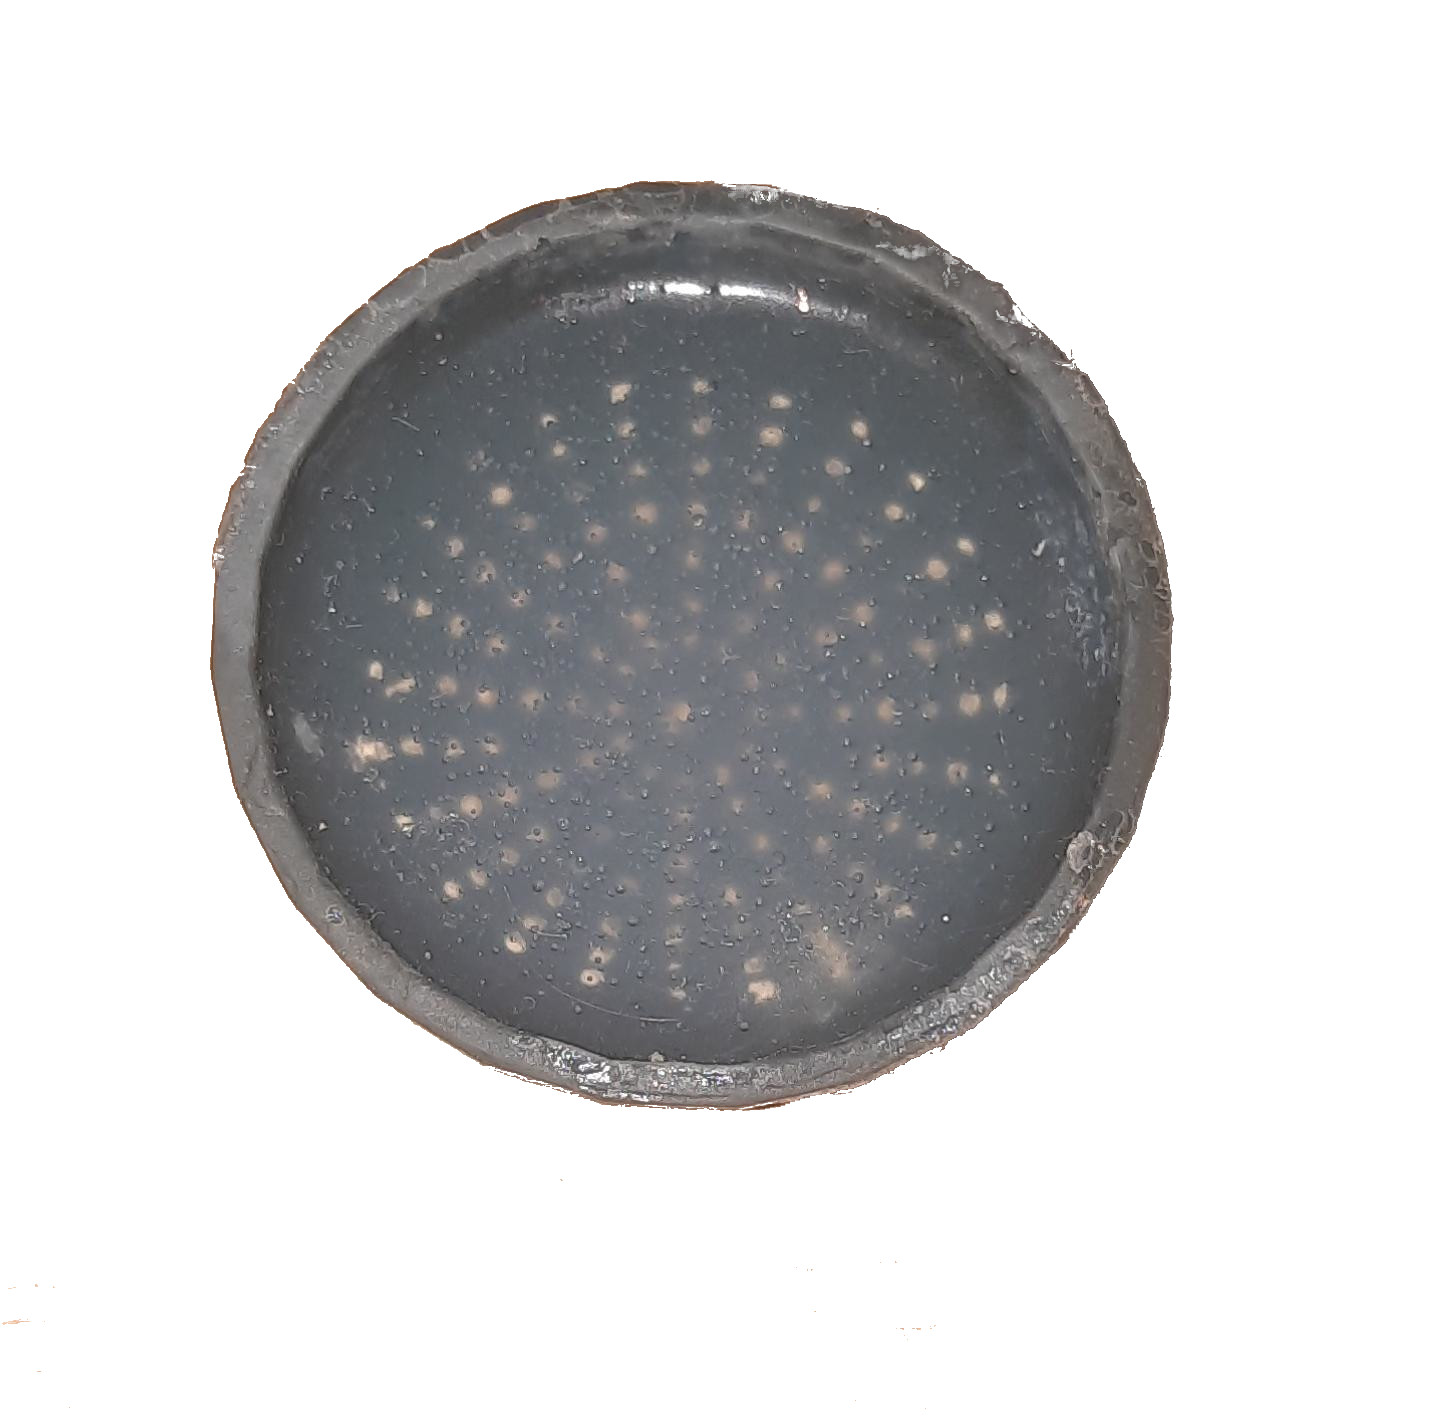
Soft-bodied skins are produced through silicone within a 3D-printed plastic mould. This mould was measured to fit the silicone inside a thin layer, with small holes in to create the tips that would later be painted white. The moulds were printed in high resolution to capture the 1mm diameter of the optical markers. The outcome would have a 42mm diameter exterior and 38mm diameter interior, where the skin has a 2mm thickness. Experimentation on thickness of the skins, and its effect on sensitivity was not the focus of this thesis, but remains fairly unexplored but has gone down to 1mm thickness. If the silicone is too thin there is an increased chance that it will break in the mould, therefore to ensure maximum durability we always used 2mm. Silicone was made and dyed black to prevent light interference or any more glare than the background levels. After being poured into the mould and left for twenty-four hours, a solid yet flexible TacTip was produced. The mould required a lubricant spray over the plastic layers to prevent the tips from getting pulled off while being removed from the mould. To paint the optical markers we used a thin layer of plastic sheet with acrylic paint. The sensor skin was turned inside out (so the marker positions were on the exterior) and gently dabbed over the paint.

Alternative designs
Alternative Bodies
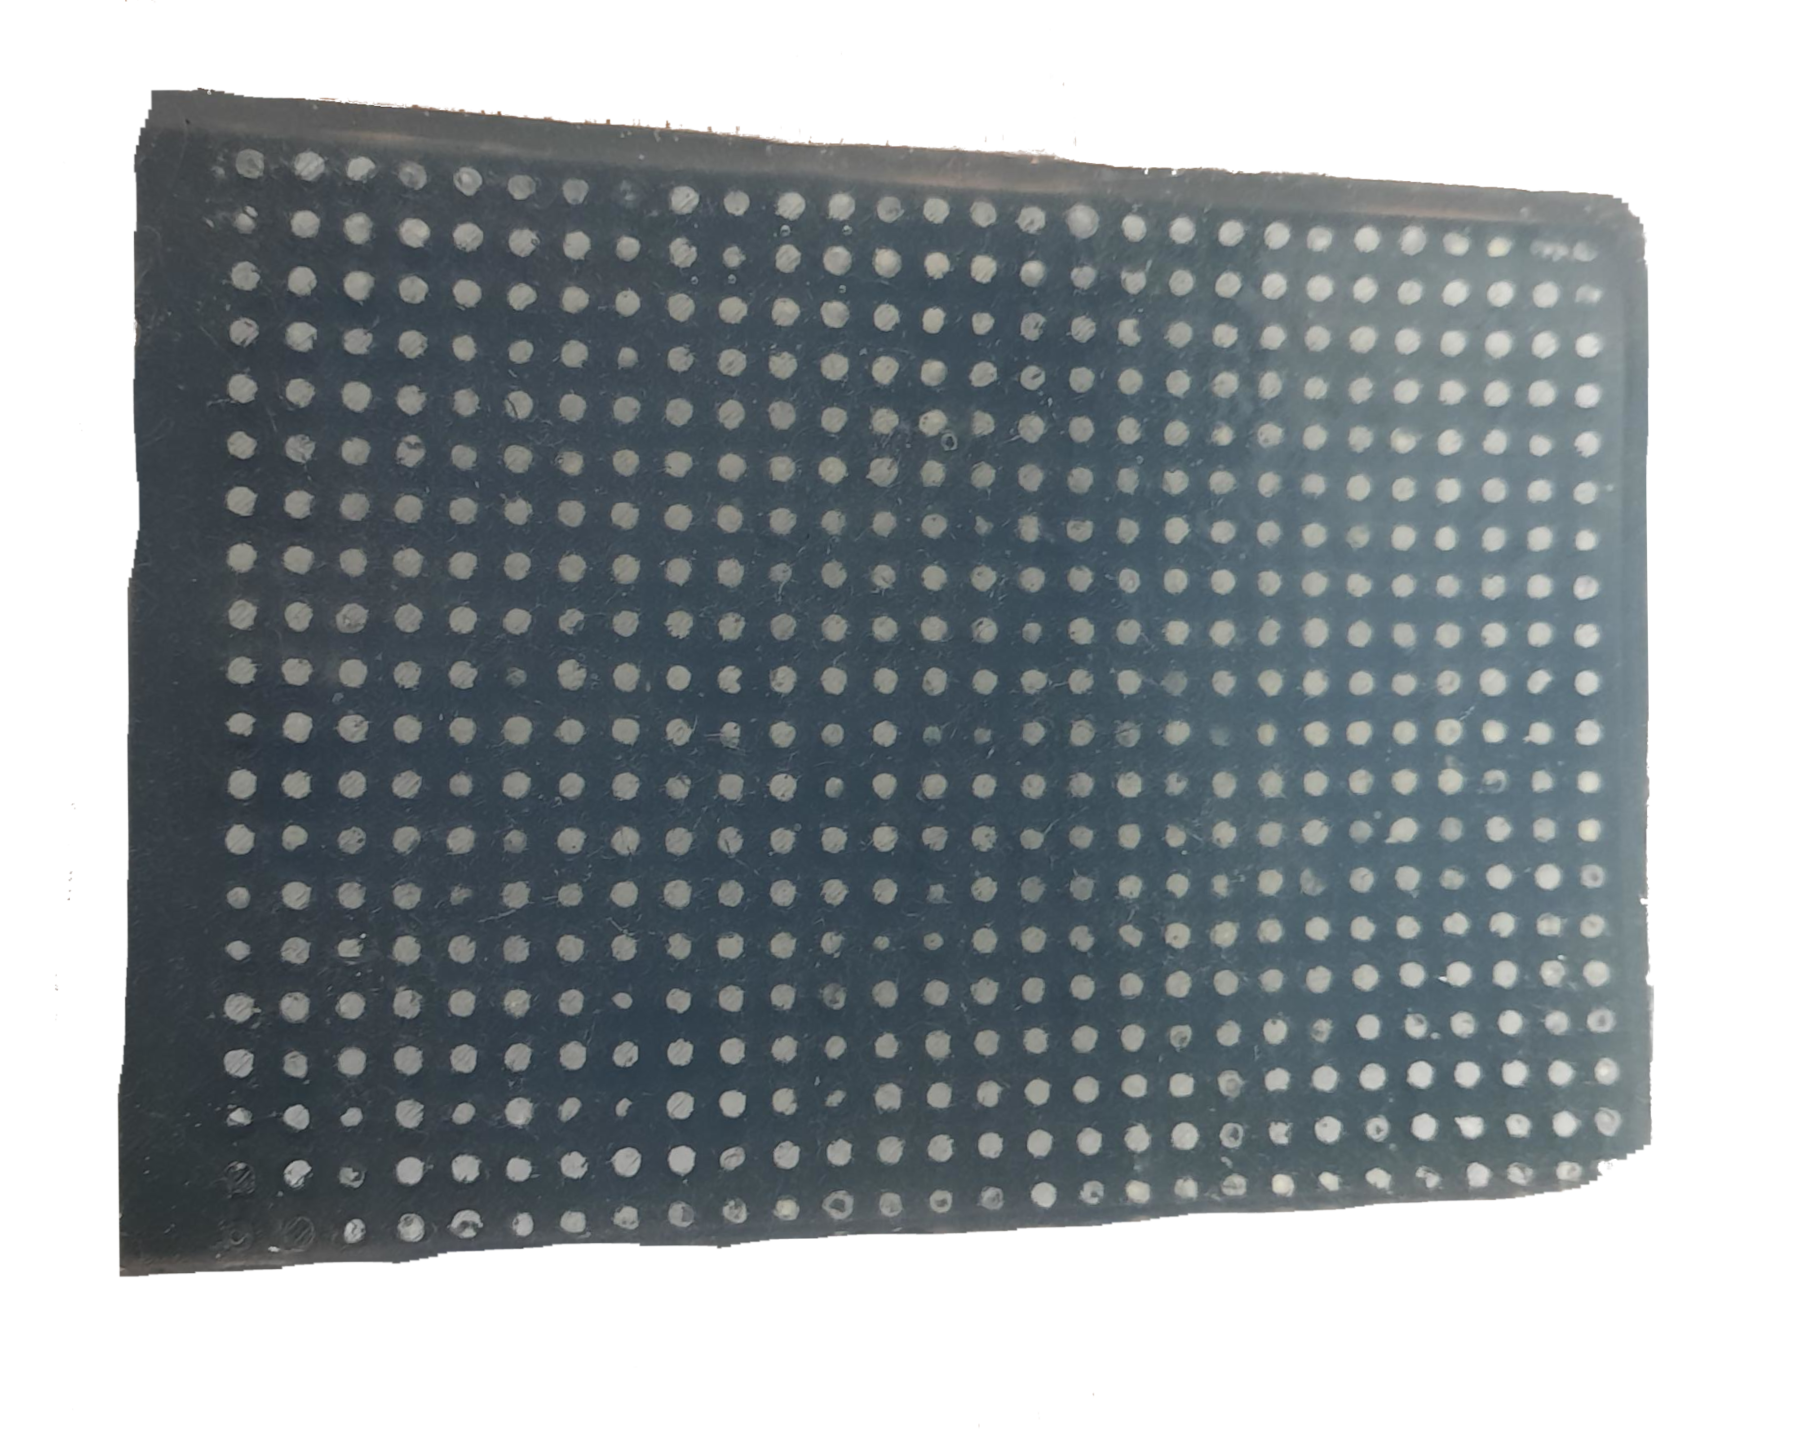
We made some alternative designs of TacTip to expand upon the optical marker detection methods. The main principle of the TacTip sensor is the displacement of the optical markers. We devised a design that uses a flat silicone rectangle with a series of optical markers on the surface. With a camera facing this mesh, we could get tactile feedback over a surface area of 100x150mm. Each dot was 2mm in diameter, which is larger than the optical markers on the TacTip. Silicone was poured into the mould, then once set each dot was painted white (as we did with the original TacTip). Using a layer of clear silicone we made the flesh part of the skin, where a box of the same dimensions as the skin acts as the mould. Our skin is placed in the bottom of the box, with optical markers facing up. The clear silicone is poured onto the skin. We do this to protect the optical markers from having too much pressure making the paint wear down, and to provide a sponge-like texture for the skin to resist force.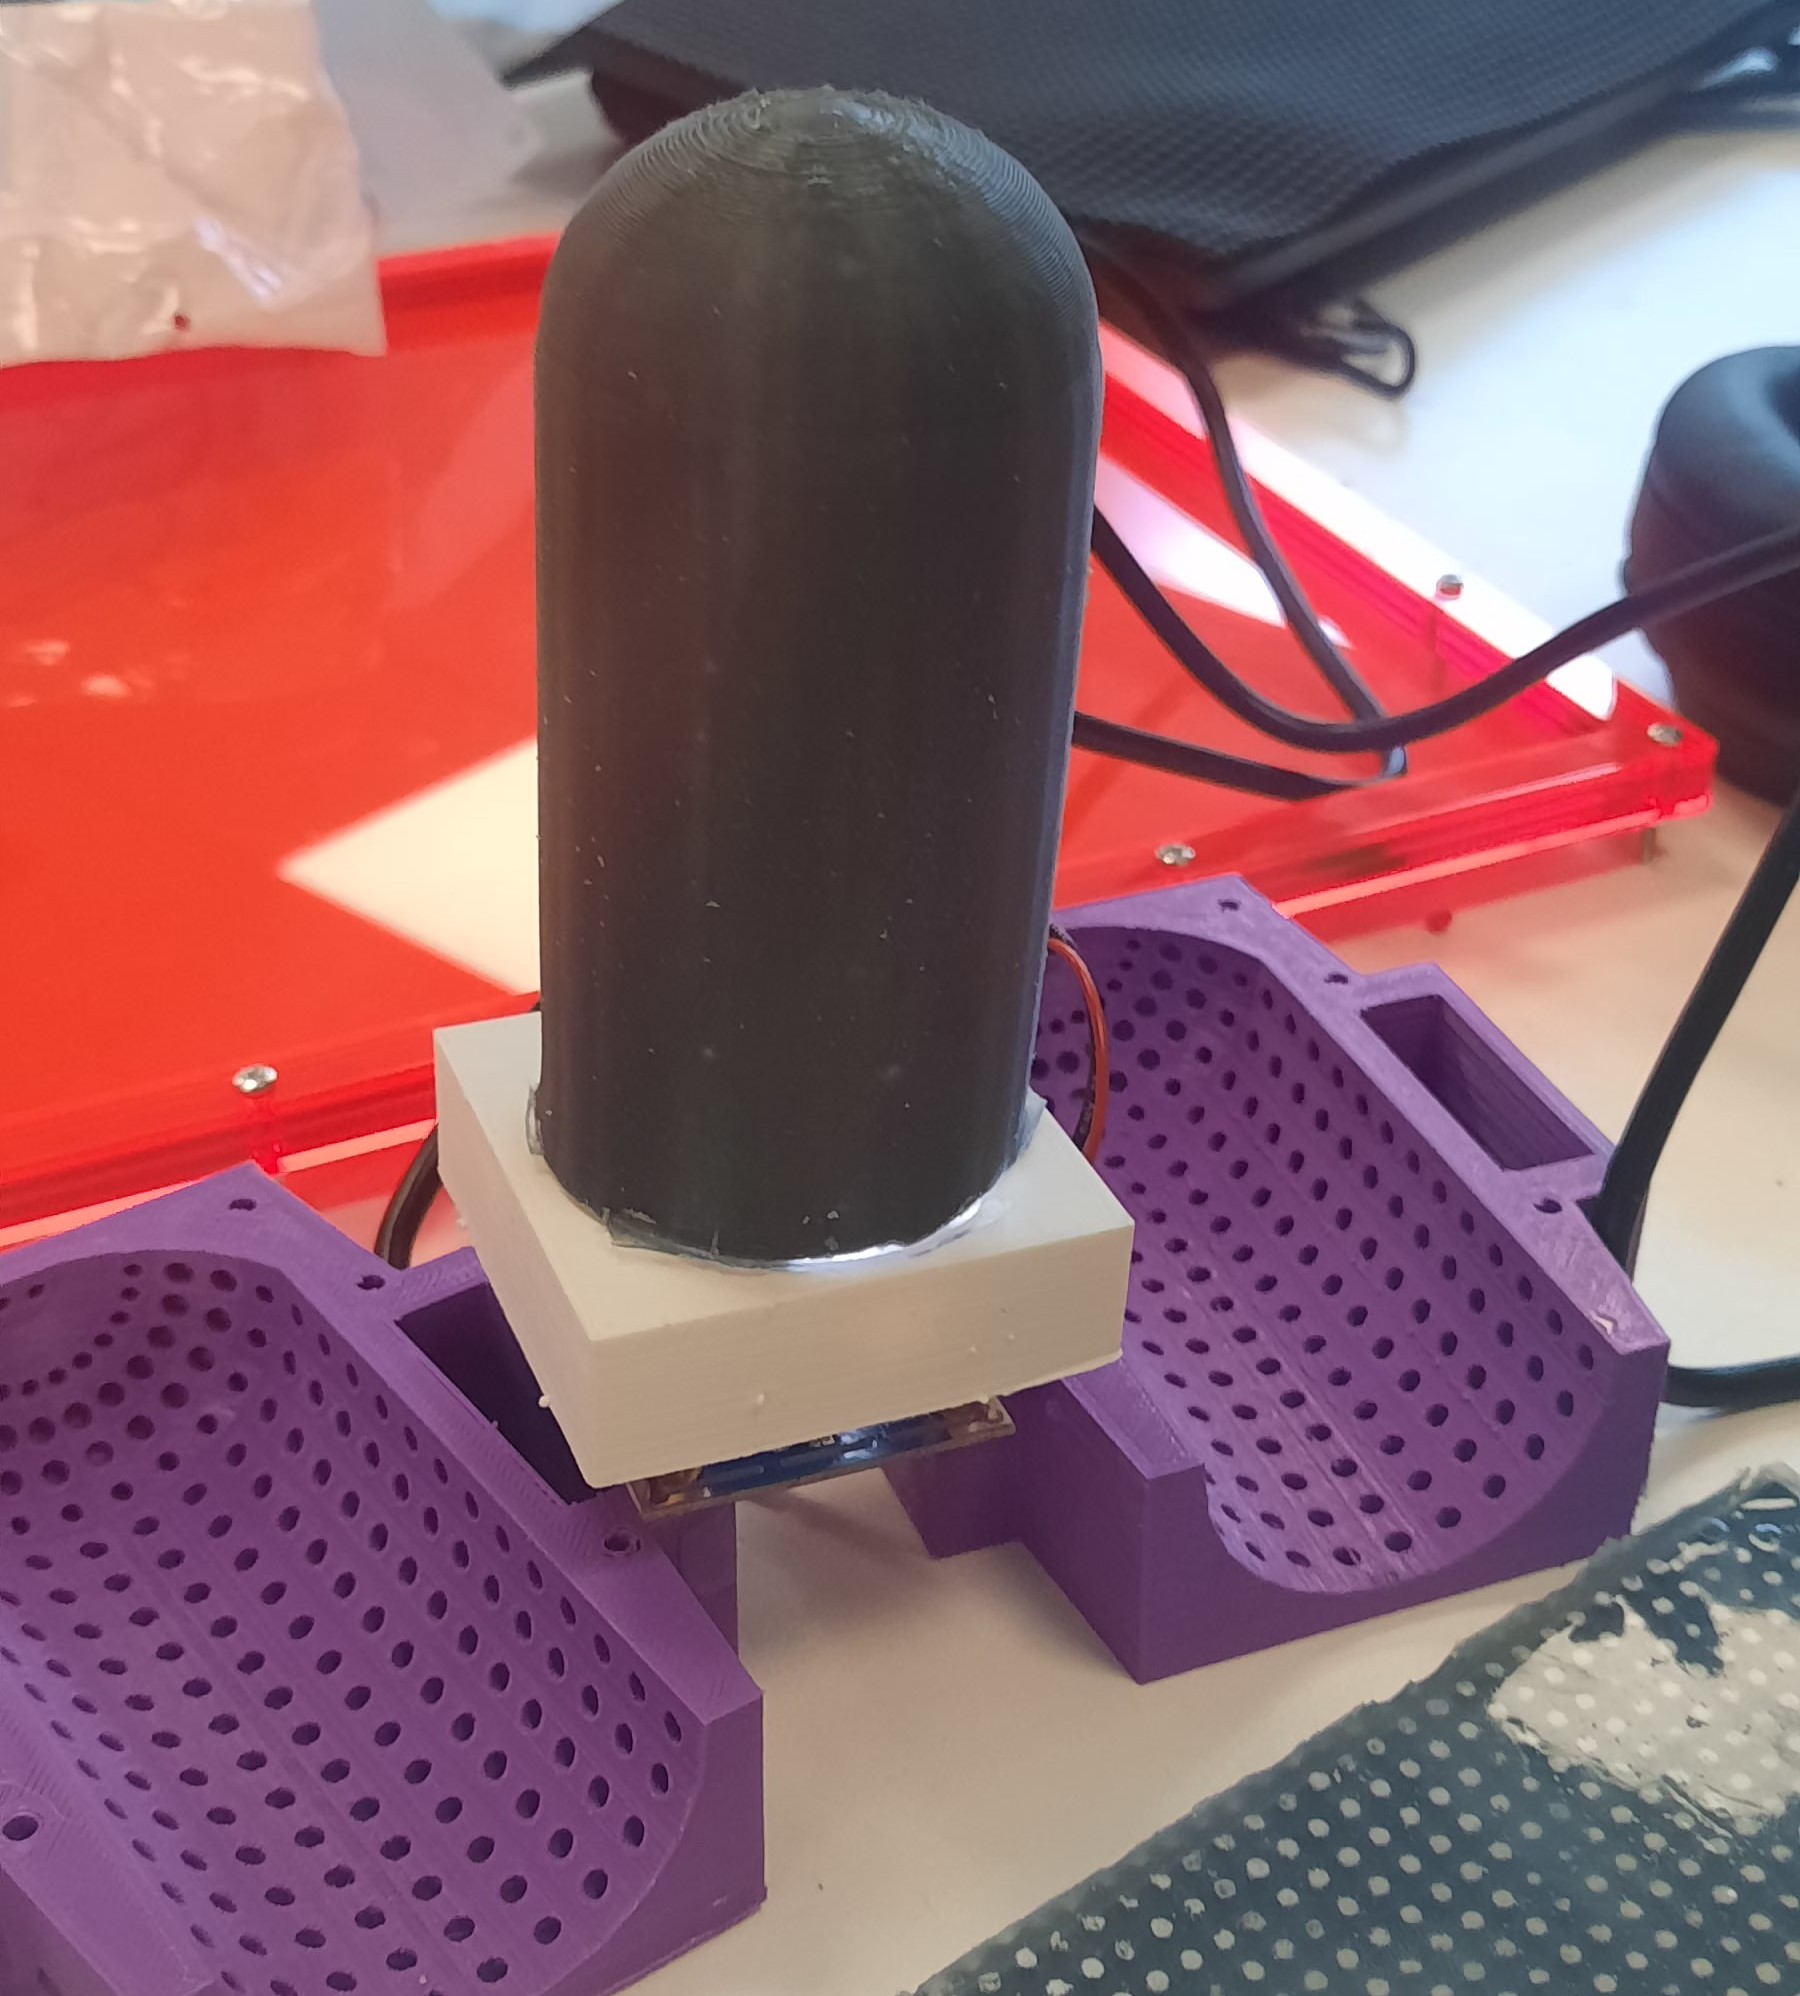

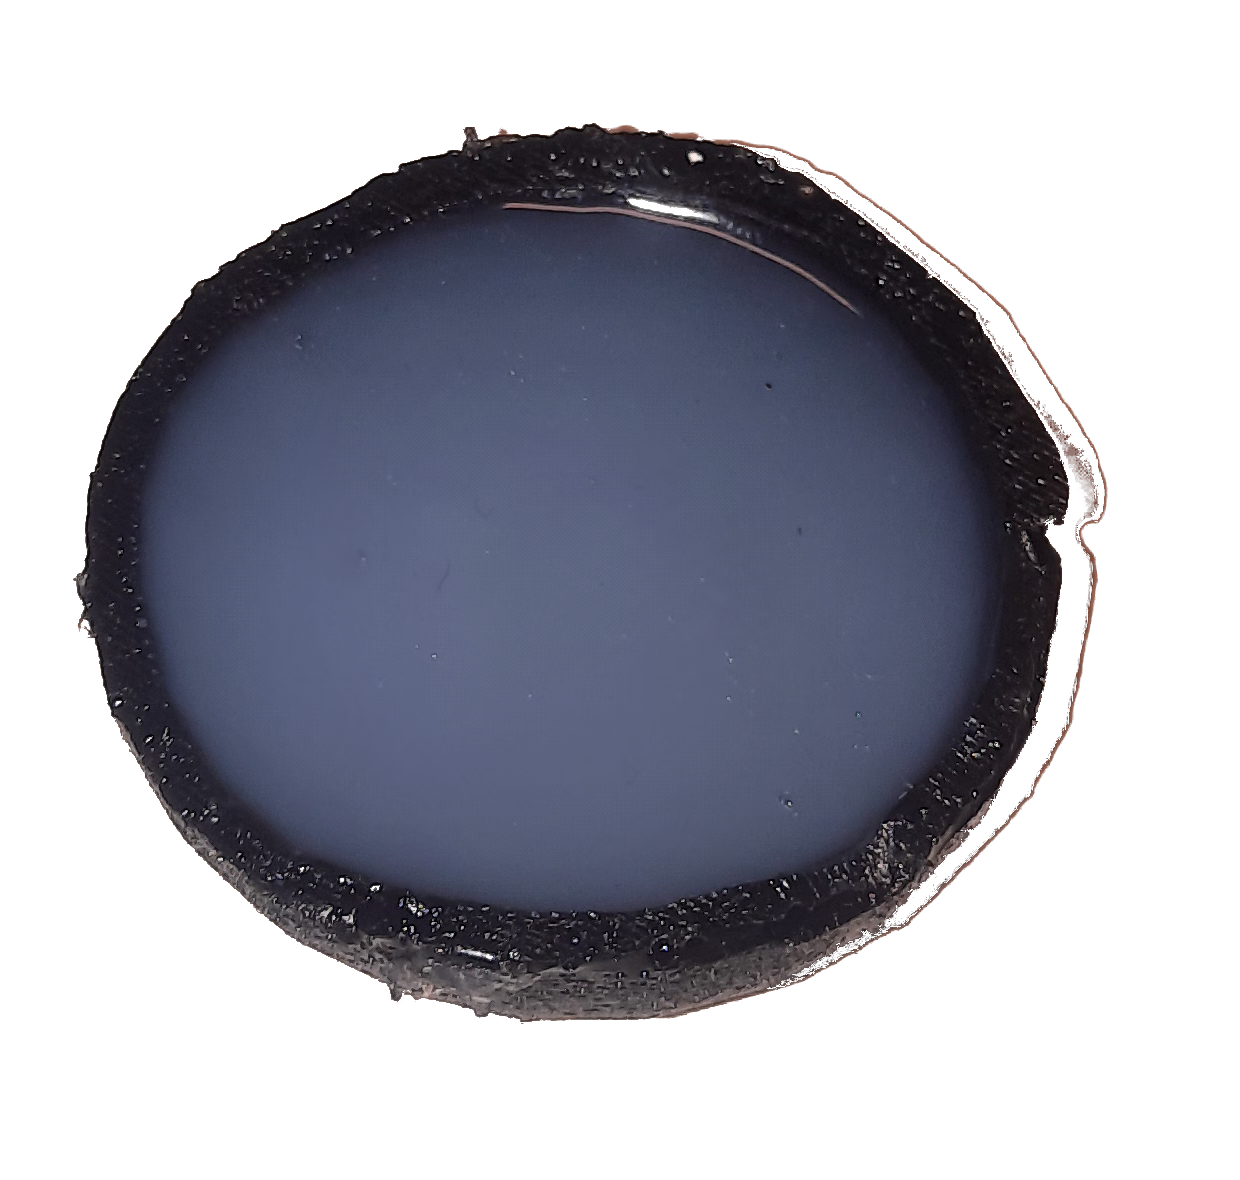
We constructed the TacLeg from a 3D-printed mould. Initially, the skin would come out in reverse and need to be turned inside-out. We did this because when the mould is peeled off sometimes the marker points are destroyed. The inside-out method helps prevent this. These designs were limited by the cameras being able to focus at short ranges.
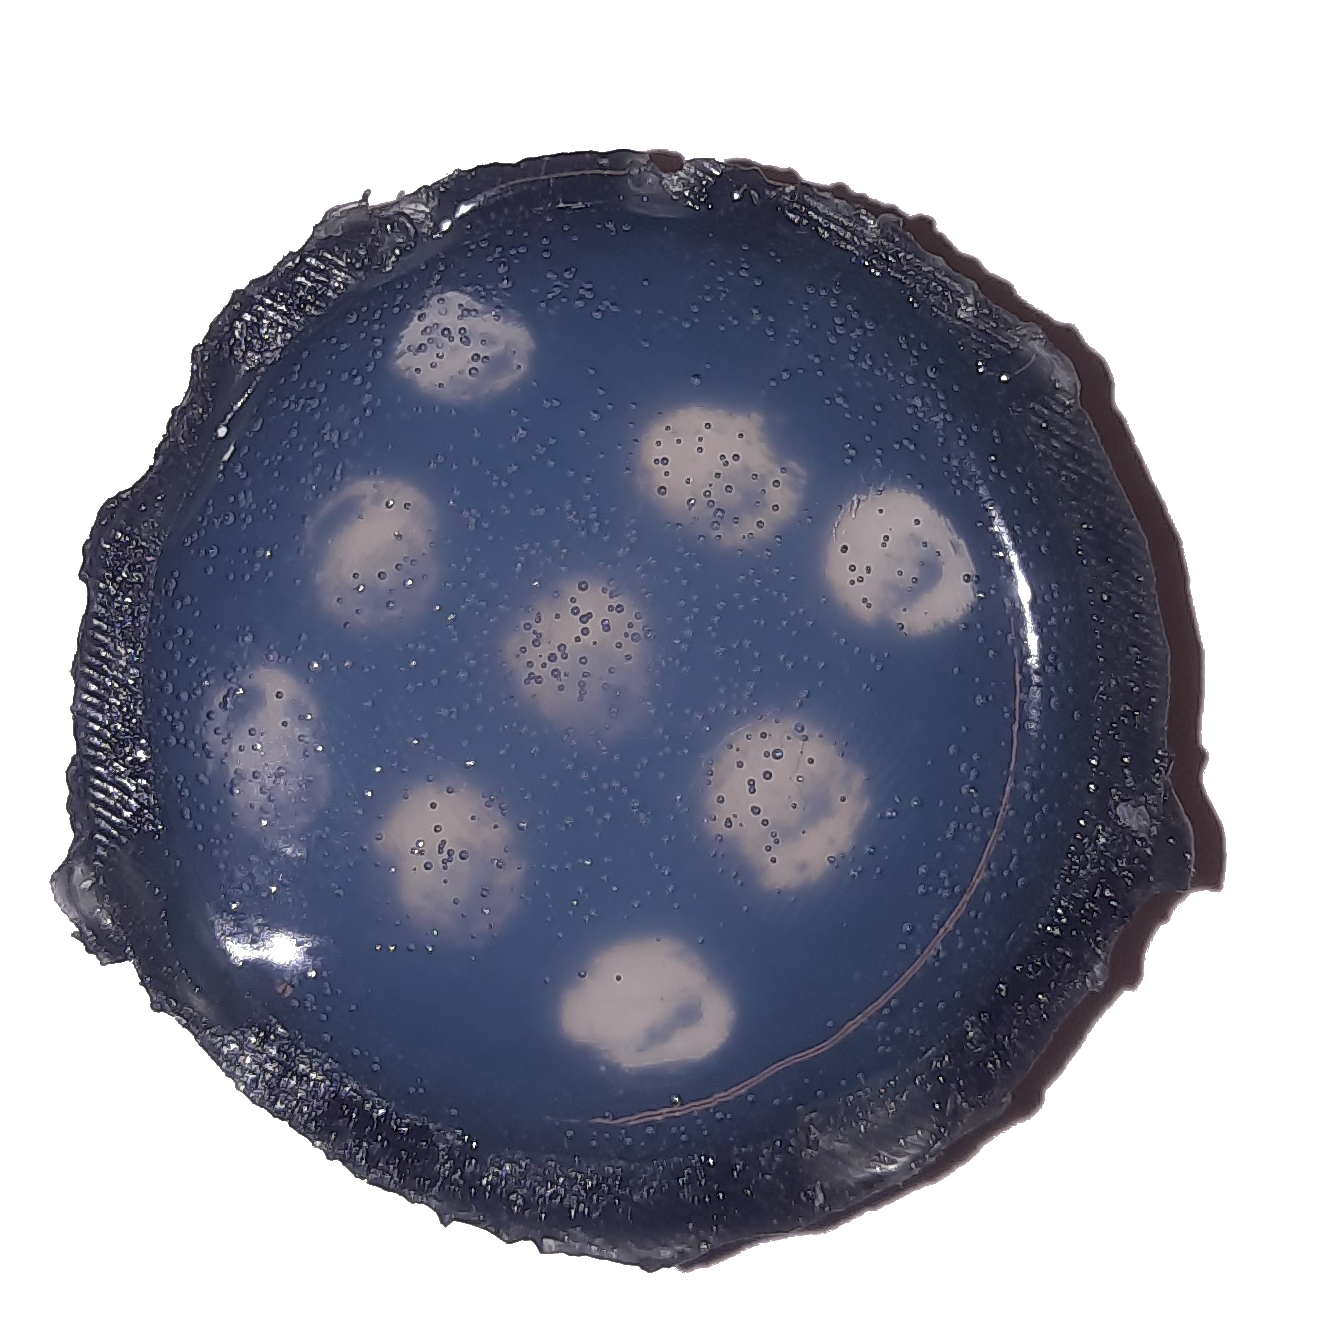
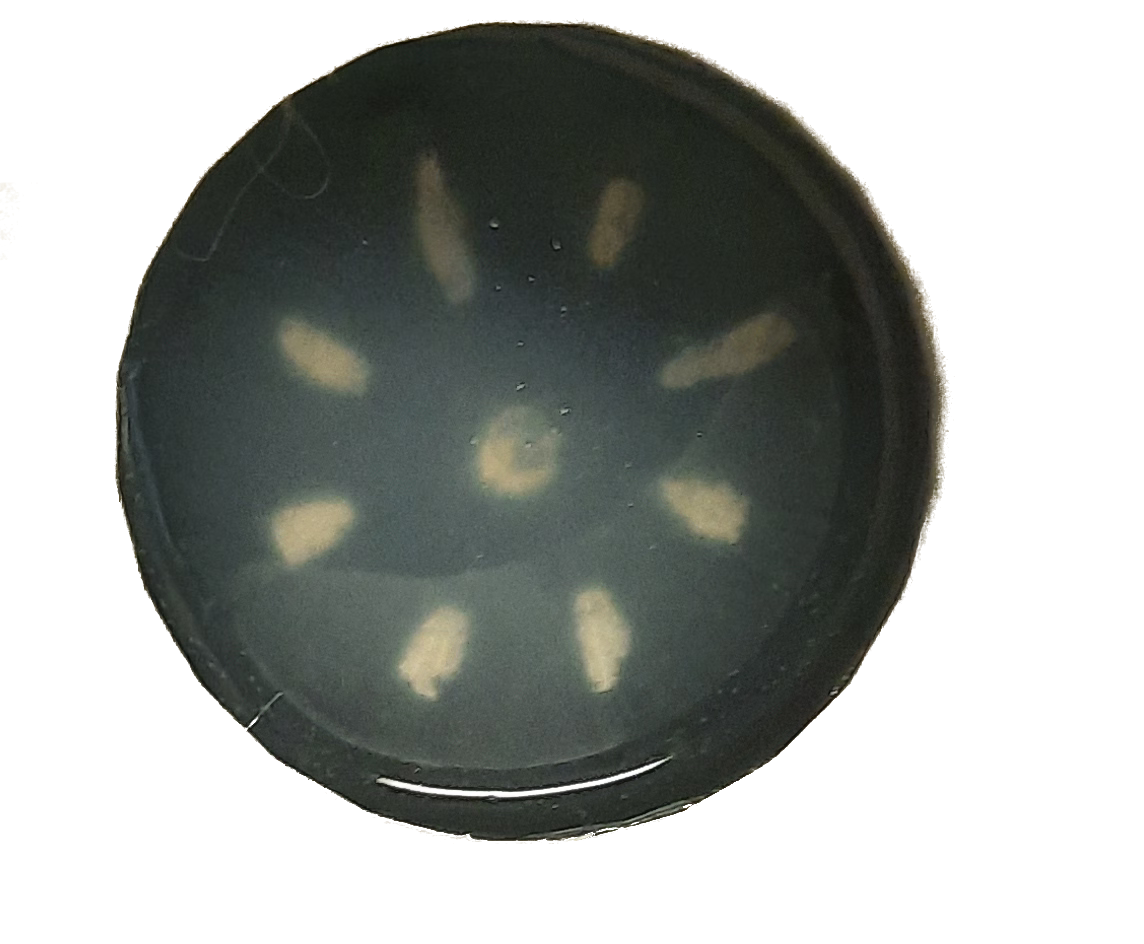
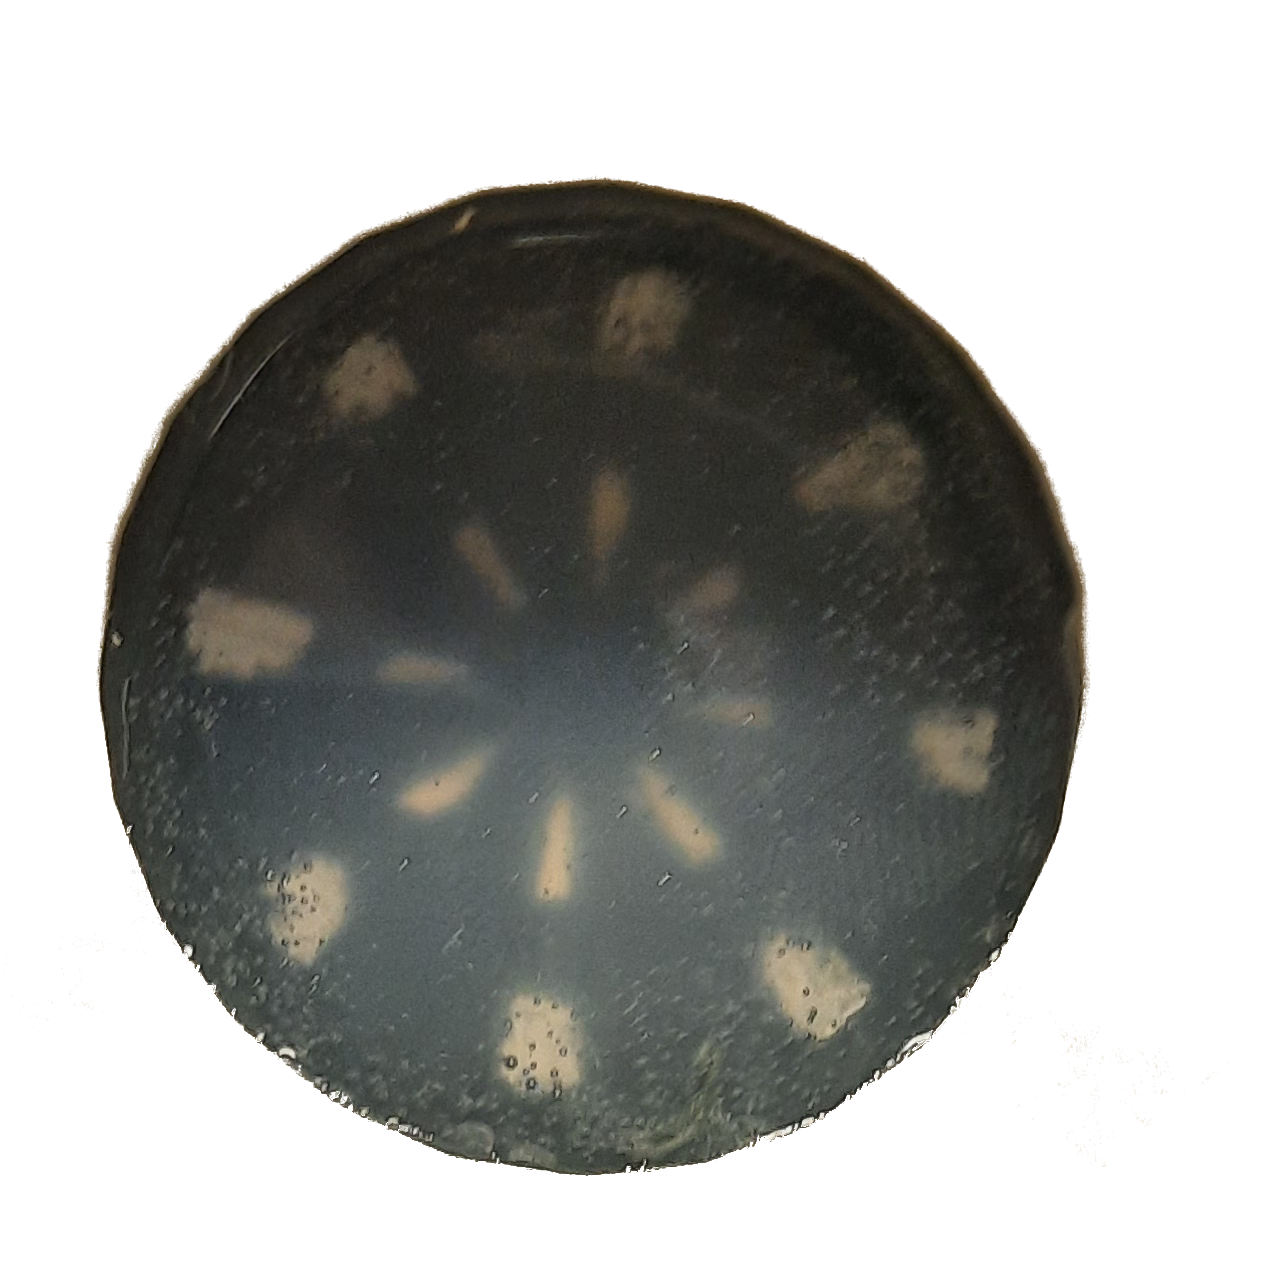
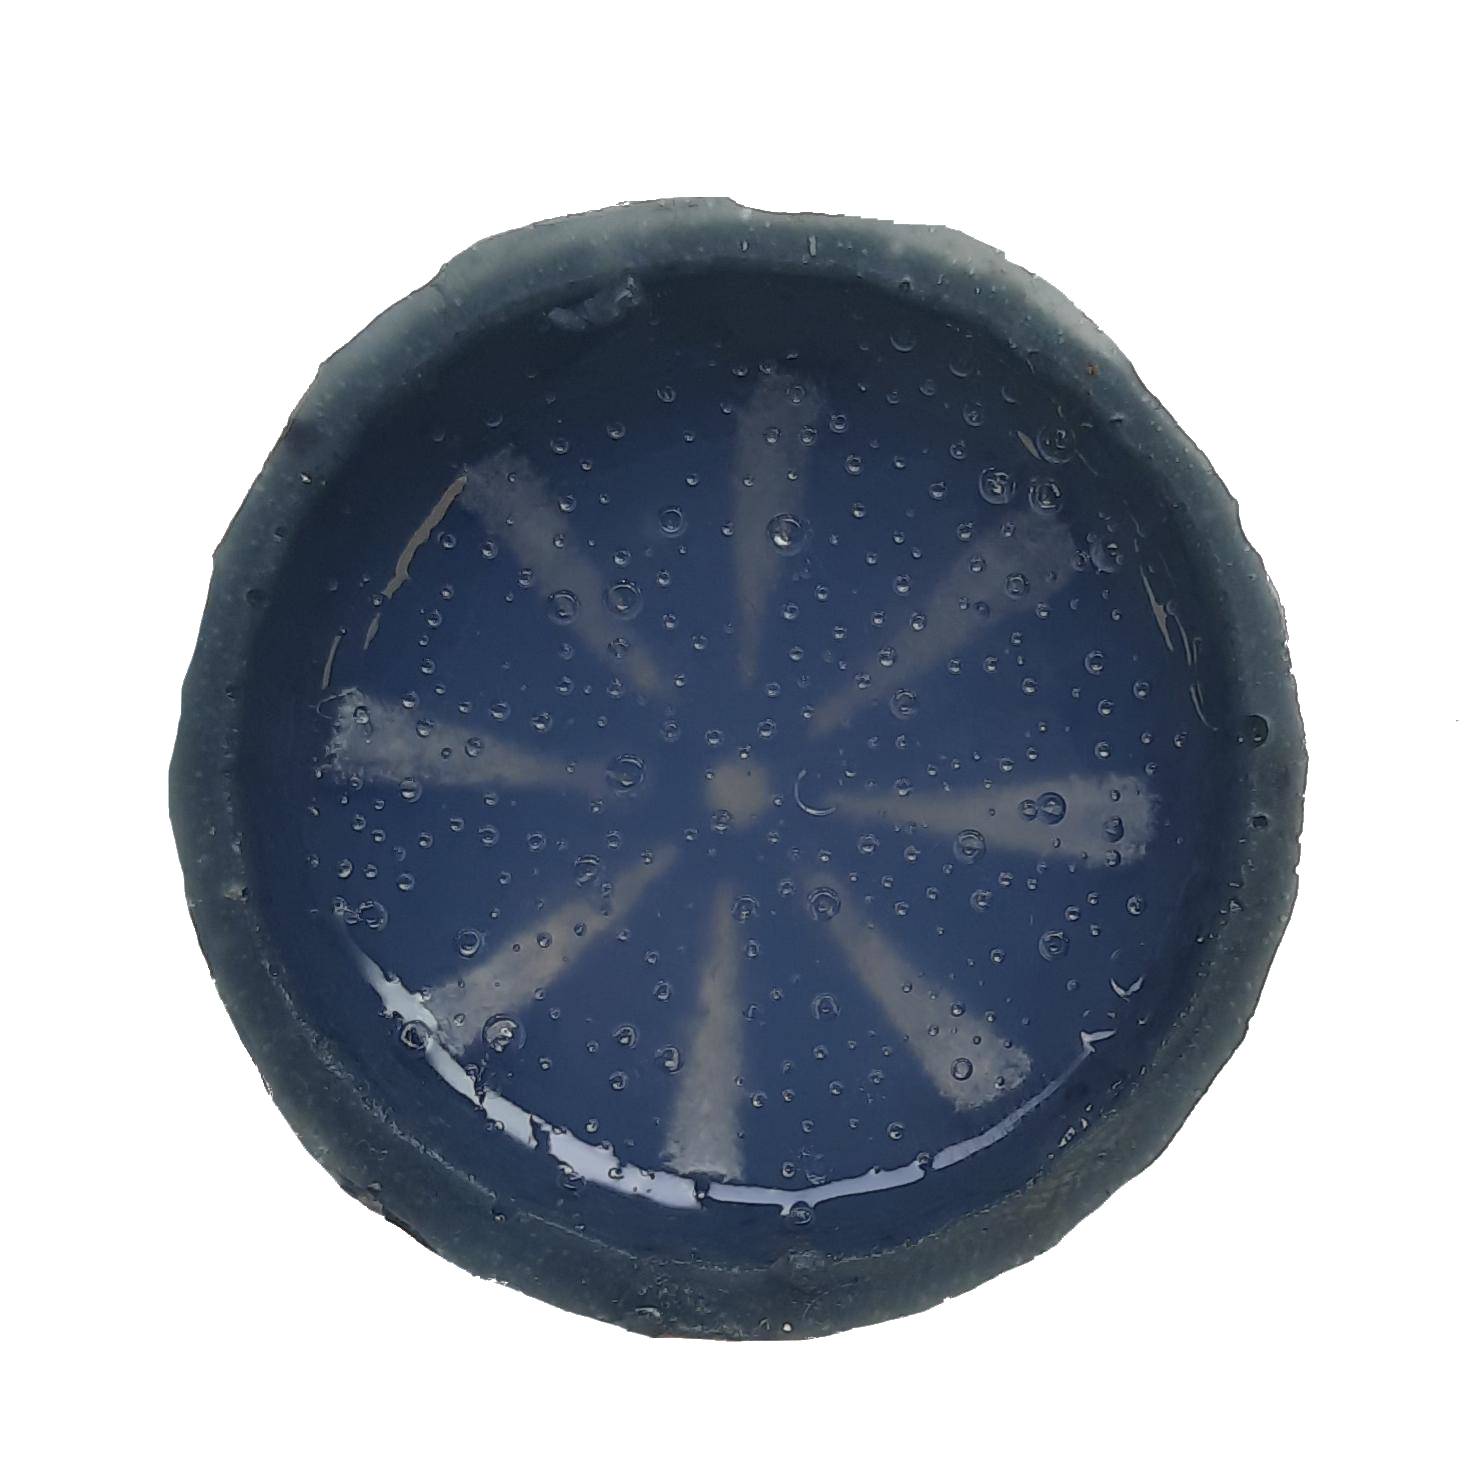
Alternative Tips
Using the standard TacTip body design, we can investigate a range of optical patterns. To what extent do optical markers influence the accuracy achievable by optical tactile sensors? In previous work, we used a standard array of 1mm optical markers, and more recently introduced large marker stripes in a new sensor morphology. Previous work has suggested that markers are not a requirement for optical tactile sensors. Despite this, the role of marker size, shape, and spatial distribution remains largely unexplored. This raises a fundamental question in tactile sensor design: to what extent does sensor morphology influence learning performance, and can alternative marker configurations, or even marker-free designs, achieve comparable accuracy while enabling lower-resolution sensing? We investigate the impact of marker size and frequency by experimenting with a range of optical marker designs. These include larger markers in various patterns-some composed of long lines, others of short segments, and some using non-linear or irregular shapes. While there was no strict design theme, the variety allowed us to qualitatively explore performance differences. In the future, algorithmically generated patterns could enable a more systematic and quantitative analysis. Our central question remains one of resolution: Can larger or differently shaped markers achieve similar accuracy to smaller, denser ones?The new marker skins were attached to the rig setup and used to gather the same dataset as previous experiments. We apply Sobel filters and reduce the images by mean scaling. All the preprocessing steps and model parameters matched that of all previous experiments. We chose the CNN model due to its success in previous experiments.
Marker Prediction
We labelled and trained a regression model to predict the location of optical markers, in an effort to reduce the dimentionality of the data.We employed the use of three regression models: Ridge Regression (with alpha = 1), Linear Regression, and Random Forest Regression (RFR) with depth 25. These models were trained 20 times with different random states, and the performance metric was determined by the average distance between labelled and predicted points divided by the diagonal pixel space \( \sqrt{h^2 + w^2} \) to normalise the error. We then subtracted this normalised error to obtain a percentage accuracy. The values were normalised to make them comparable across any image size florence2020dense, articlestats.
Images were converted to greyscale as a preprocessing step, and a Sobel filter was applied to highlight the markers and reduce noise yergibay2024nusense. Results of this experiment are shown in Table 1.
| Model | Av Test Accuracy | Av Train Accuracy | Test Std |
|---|---|---|---|
| Ridge | 87.902% | 99.99% | 0.72% |
| Linear | 87.19% | 99.9% | 0.87% |
| RFR | 76.79% | 82.41% | 1.55% |
The Ridge regression model performed the best out of the three models. We suspect some of the issues may stem from the large dimensionality of the input data, which also caused some of the models to take hours to train. We therefore employed Principal Component Analysis (PCA) to reduce the high-dimensional image data to 150 components. This smaller dataset was then passed into the models.
Results of this experiment are shown in Table 2. This approach led to increased accuracy for the RFR model, but little difference in test accuracy for the other models.
| Model | Av Test Accuracy | Av Train Accuracy | Test Std |
|---|---|---|---|
| Ridge | 87.95% | 80.64% | 0.48% |
| Linear | 88.11% | 80.55% | 0.48% |
| RFR | 85.83% | 88.92% | 1.13% |
Although the regression models show strong accuracy in point prediction, it raises questions as to whether this dimensionality reduction step provides benefits for classification tasks. There is an additional processing layer from image to point extraction. Furthermore, slight prediction errors may impact the accuracy of subsequent classification tasks.
Another limitation of the point extraction method is that the labelling process was human-annotated. Errors may arise from fatigue or mistakes during point labelling. Despite these limitations, the models performed fairly well at predicting marker positions.